How to analyze JVM thread dumps

When your java application is getting unresponsive or requests are taking time, taking thread dumps will help find the cause.

When your java application is getting unresponsive or requests are taking time, taking thread dumps will help find the cause.

This article aims to find the optimal way to search for a word in a folder containing multiple inner folders and a large set of files.

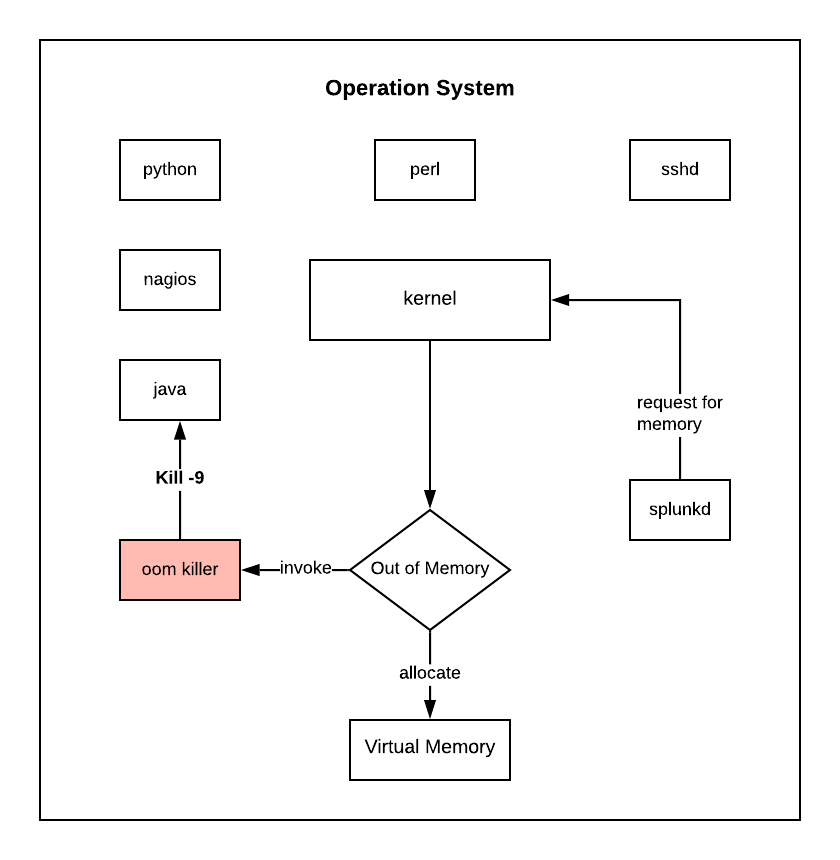
The purpose of this article is to explain how a kernel can invoke (out-of-memory) oom killer to kill a process abruptly which might be a java or node process of your application and what steps we can take to resolve...

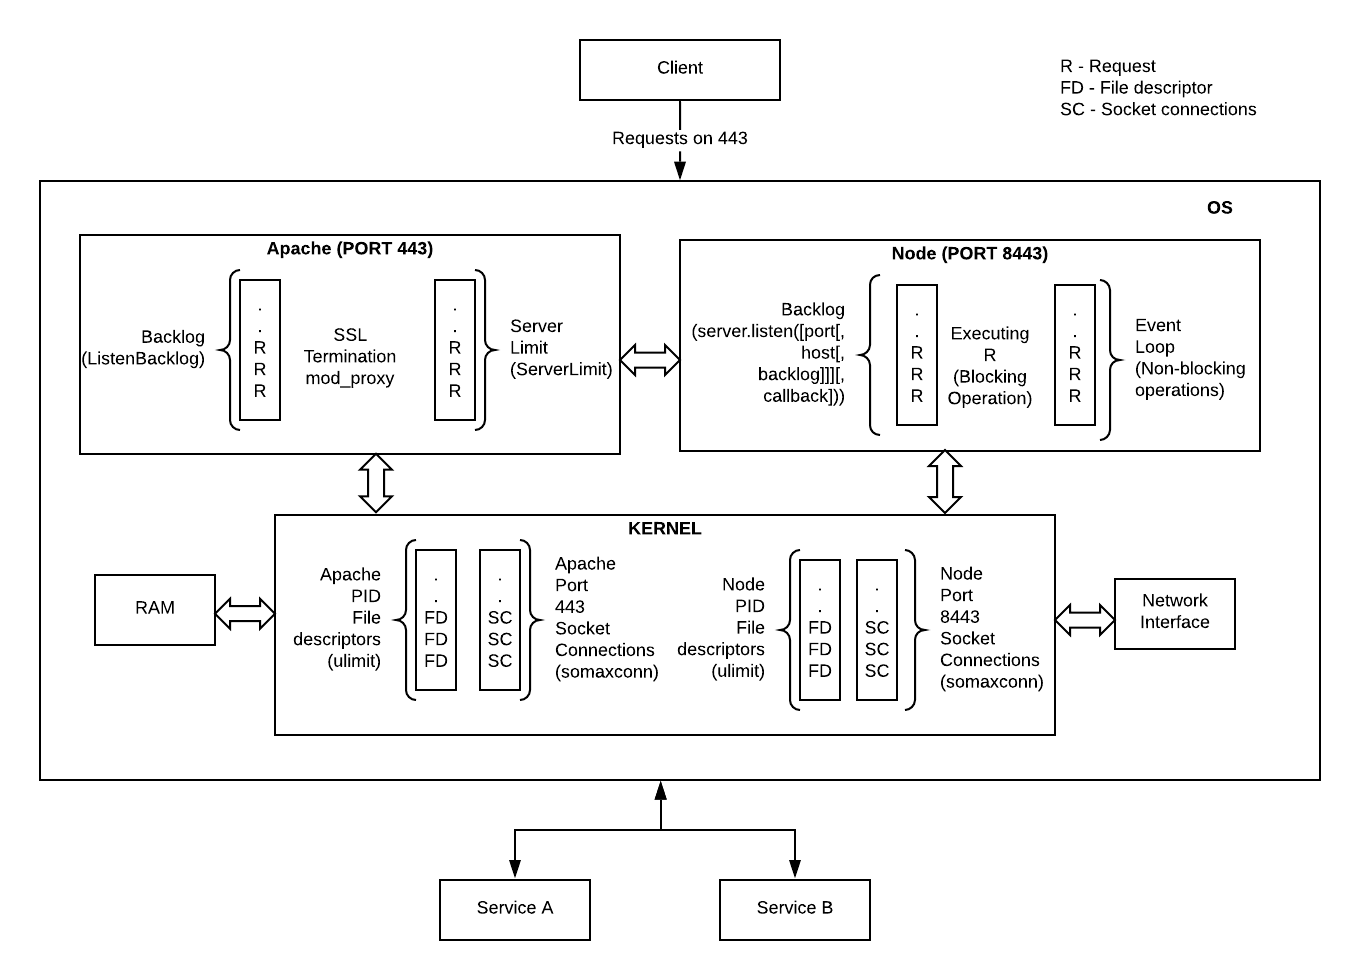
The purpose of the article is to explain default configurations (which can cause bottleneck) at Node.js, Apache, and OS level and how to change those configurations. Any configuration listed below in the diagram can affect client request processing time.

In your java application, if you had seen the below error in logs. SOURCE:java.lang.OutOfMemoryError: unable to create new native thread The above error means that when java process wants to create a new thread and requests for a new process...

Below is one example of analyzing heap dump to know which objects are responsible for JVM out of memory.

Tai Lung: gasps The Wuxi finger hold! Po: Oh, you know this hold. Tai Lung: You’re bluffing. You’re bluffing! Shifu didn’t teach you that! Po: Nope. I figured it out. Skidoosh. — [Kung Fu Panda]

Below are some essential shortcuts built-in in Bash (and in Zsh), which enables a user to quickly move around the current command, edit it, and utilize previous commands.